Monthly data
You can enter data on a monthly basis. This is necessary if you want to monitor the results on a semi-annual or quarterly basis. But you do not need to enter all data every month for this. Annual data will be divided automatically when splitting (into semi-annual, quarterly, etc.).
With some metering companies, it is possible to set up a data link to make it possible to have all monthly energy data entered into the Envirometer automatically.
Note: Data links are only available for Dutch companies.
Enter monthly data
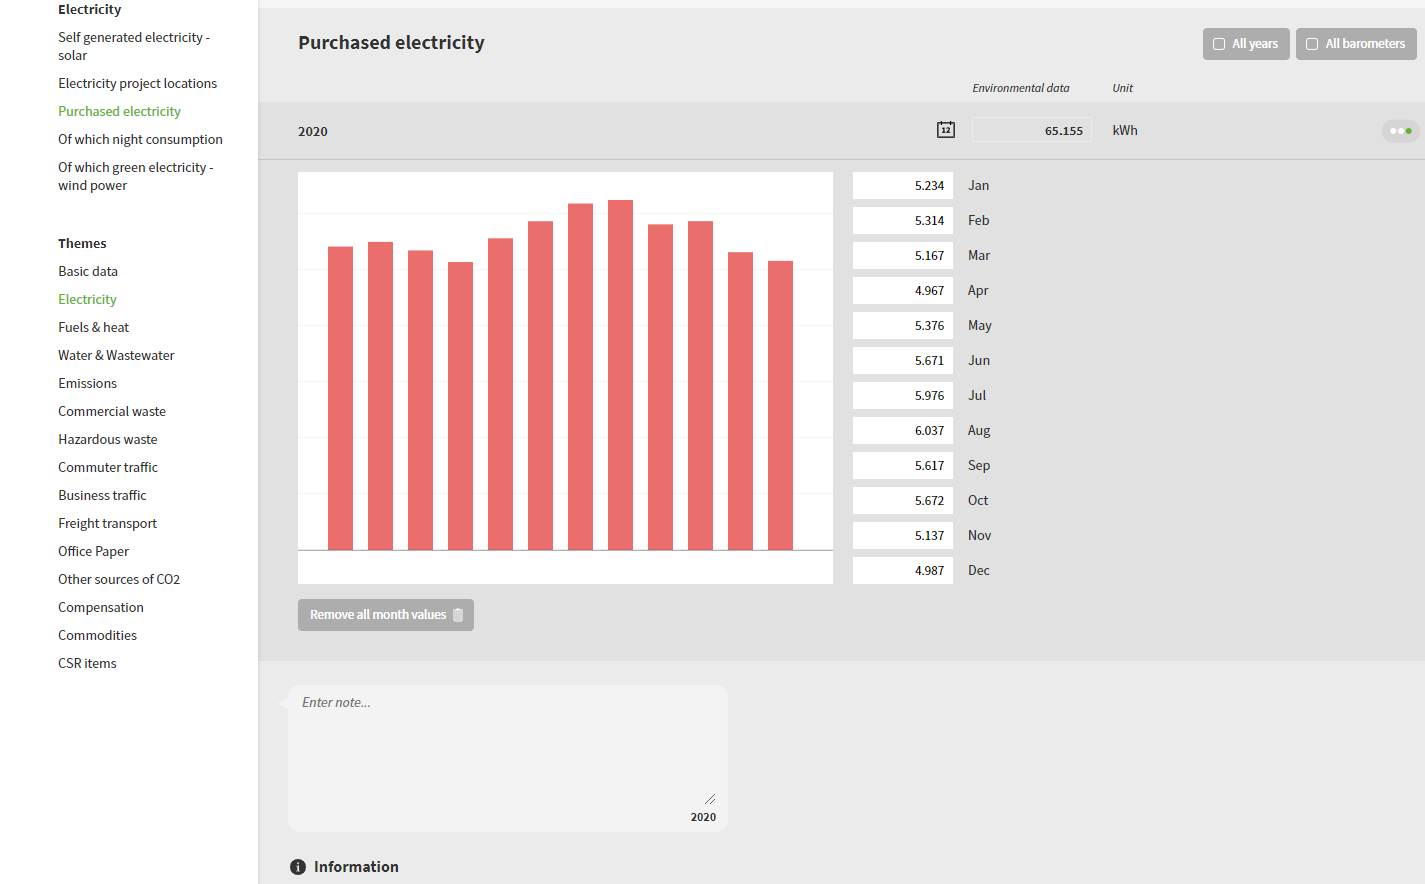
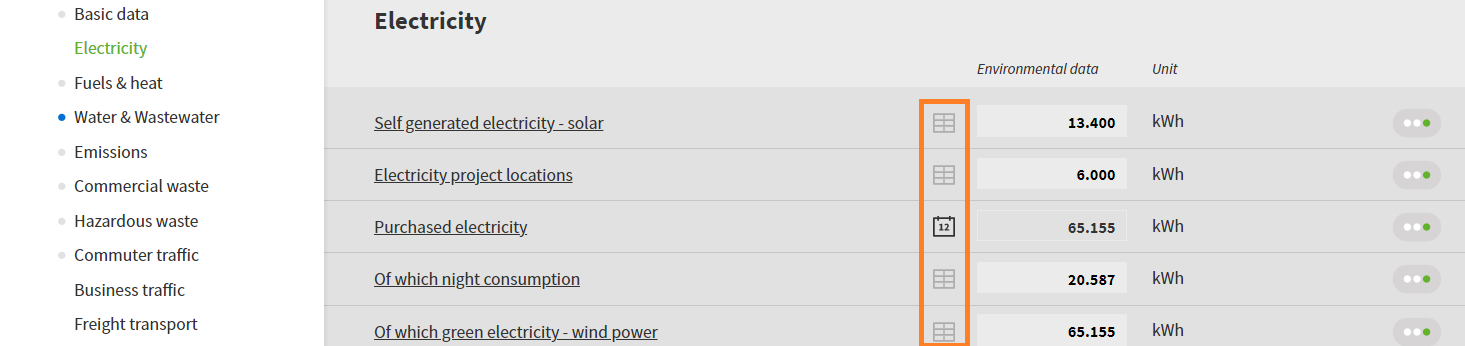
When entering data, go to the monthly data section via the table/calendar icon (for the input field).
- Fill in monthly data via one of three options:
- Fill in monthly values every month
- Copy and paste a lijst to fill in multiple months at once
- Automatically fill in monthly data through an API
- If it is not possible to complete all months, you can switch the status dot to blue as a reminder that some data is still missing.
- The counter next to the input field shows the number of months already completed.
- In the monthly chart you can see whether the pattern is logical and identify any outliers.
- At the bottom, you can delete all monthly data at the same time via Delete all months.
Tip If you want to enter the half-yearly figures instead of monthly, complete the months of June and December, for instance, and leave the rest empty.
Copy and paste lists of monthly values
- Select a list of monthly values (in a spreadsheet or text document).
- Copy that list (Ctrl+C or right-click > Copy).
- Place your cursor in the month where the first number should appear and choose Paste (Ctrl+V or right-click > Paste).
- The paste function adjusts values in two ways (examples in image):
- Numbers with a single comma or period are given a comma.
- Numbers with a single comma and more than three significant digits are rounded.
- Red crosses mark values that do not fit (examples in image):
- Values that are not numbers.
- Numbers with more than one comma and/or decimal point.
- Numbers with more than 13 digits.
- Check the result.
- Use reset to delete any values that have not yet been saved.
- You can then copy and paste an improved list.
- The list only becomes final once you confirm at the bottom.
Monthly and annual figures for half-yearly or quarterly reports
Some companies monitor and report half-yearly or quarterly environmental figures, for example if their business activities are highly seasonal. The CO₂ Performance Ladder (SKAO) used to require half-yearly reporting, but this is no longer necessary as of CO₂ Performance Ladder Manual 4.0.
- Data for which you only have annual figures can be entered as annual figures; the Envirometer will automatically distribute them over the months.
- If you have half-yearly data, you can enter it as “monthly data” for one month in the first half of the year and one in the second half of the year. We recommend using the same months for this every year, for example June and December.
Half-yearly or quarterly graphs and reports
- Under Graphs, Indicators, and PDF report , you can switch from year to half-year (or quarter) in the top right corner (oval button) and choose which one you want to view.
- Half-years are the default setting. You can set quarters under Barometers.