CSR-Data
CSR data lets you add targets to the Envirometer, making it possible to broaden the Envirometer to make Sustainability and Corporate Social Responsibility measurable. Consequently, you can use the Envirometer not only for environmental certificates, but also for such CSR quality seals and standards such as:
- ISO 26000
- CSR Performance Ladder
- MVO-Wijzer (CSR directions)
If you activate the CSR data theme, various types of CSR data will be added to your input field. These are intended as inspiration and an invitation to put together your own list of CSR data.
Edit list of CSR data
- As with all other input data, you can add or remove data from your input field via finetuning.
- But, most importantly, you can personally add and/or edit characteristics of CSR data via Manage CSR (top right):
- With one click, you can add one of the 25 basic suggestions for CSR data to the list.
- You can even create completely new CSR data and add it to the list via “Define new CSR data”.
- All added data can then be edited using the pencil icon after the entry.
- You can change the order of the data by dragging the data up or down using the dashes before the line.
Tip: Find more information about selecting Environmental and SCR-targets on the targets help page about Themes and indicators.

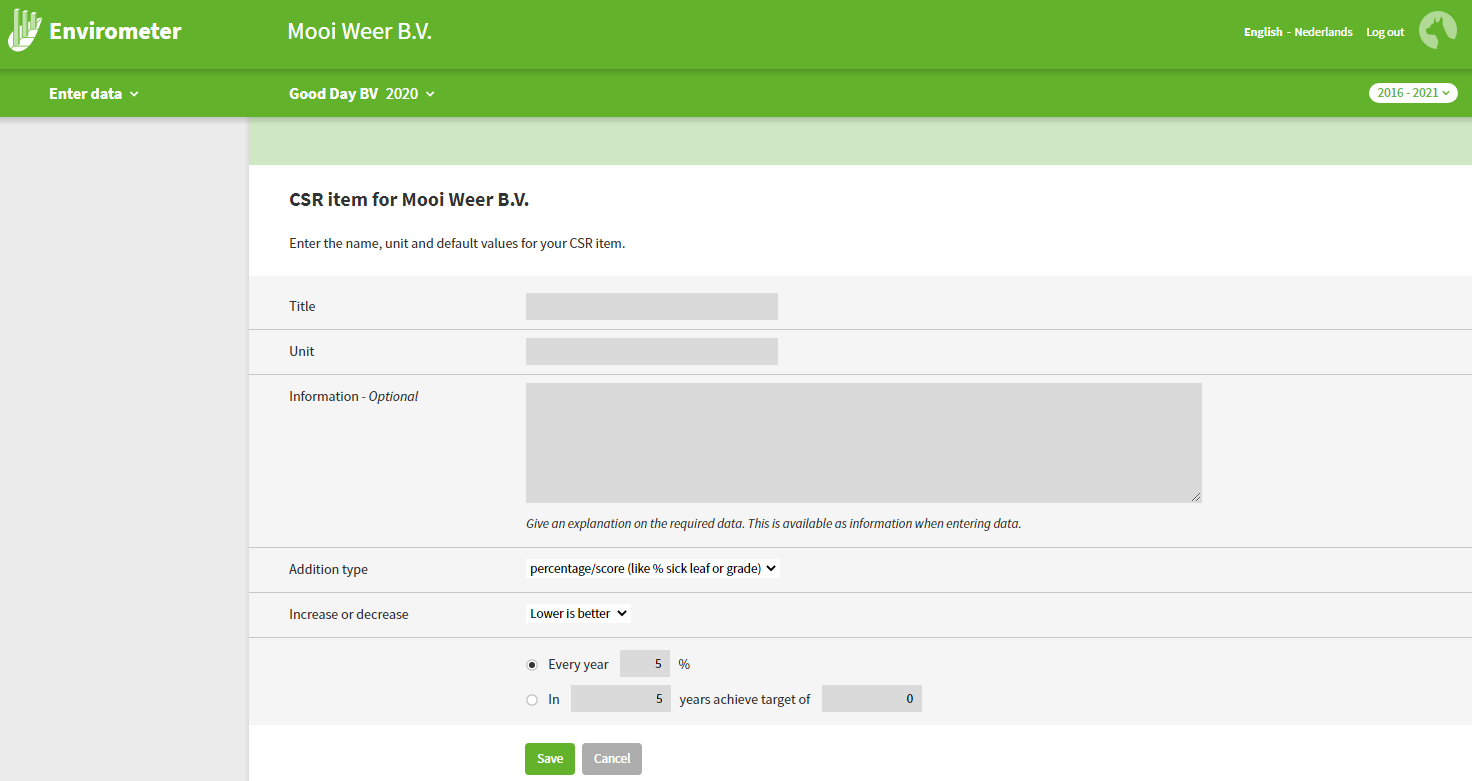
Add new CSR data
Under ‘optional information’, you can provide an instruction for the data to be entered. This is especially useful if the subscription contains several Envirometers that require this CSR data.
The goal is defined as an ‘initiative’ when CSR data is added to an Envirometer.
- The first option means: x% less/more per year.
- The second option means: The target value is y for the ‘current year + x’.
In the input field, this initiative can be edited, as with all other goals, via ‘edit goal’.
Set addition type
You can choose, for both existing and new CSR data, via CSR management how (monthly) data is added.
- Sum monthly values (default)
- Average monthly values (like FTE)
- Monthly values are averaged, but when you add up locations, the data of the locations are added up.
- Percentages/score (like % sick leaf or grade)
- monthly values are averaged, and even if you add locations, the data is averaged for the locations.
