Results
Once you have entered data, the Envirometer will translate it into graphs, key figures and CO₂ footprints. You can compare the results to other years, Envirometers for other branches or the industry average. This makes it possible to view the total environmental impact or zoom in on a theme like building-related energy or waste sorting.
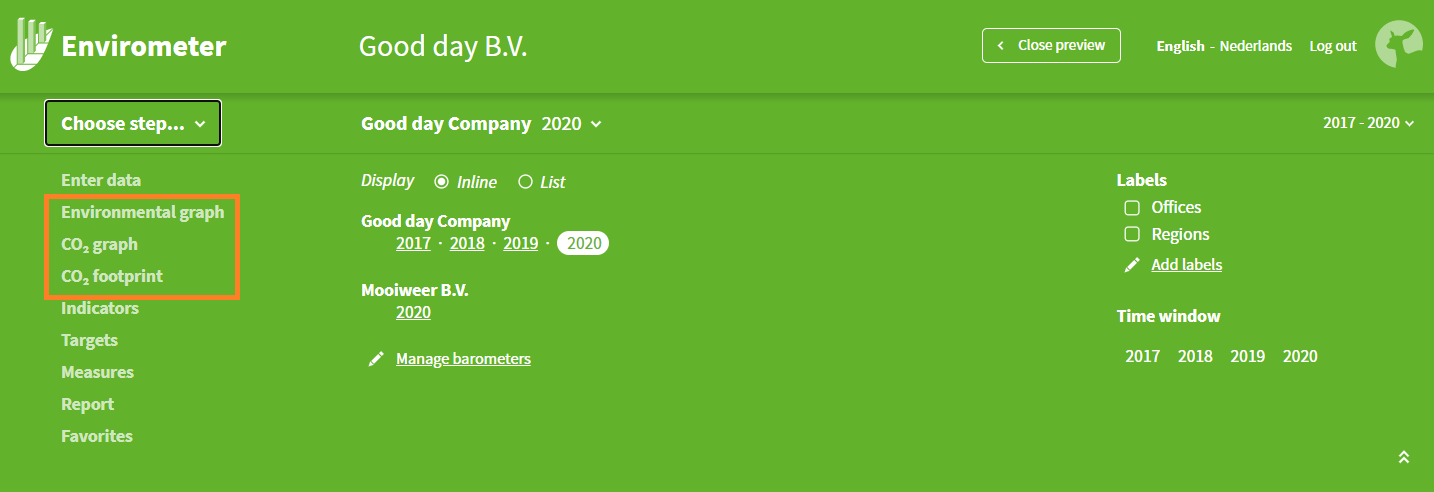
- Environmental graph
- CO₂ graph
- CO₂ footprint
- Key figures
You can then link goals to the results.