Benchmarks
Averages (benchmarks) are available in the Envirometer for dozens of industries. You can display them next to your own score and use them to compare and analyze your environmental score in both the graphs and indicators sections.
- In the graphs and indicators sections, clicking the “Benchmark” button shows you if there is an Envirometer industry average available for your industry.
- You must normalize a graph (divide by fte, m² or basic company data) before you can display an industry average next to it.
- You can view and edit the industry of your Envirometer under manage Barometers.
- The Dutch website contains more background information on the available industry averages.
Important: If you choose to display in different time periods, you can also view the industry average for the selected time period (instead of an entire year).
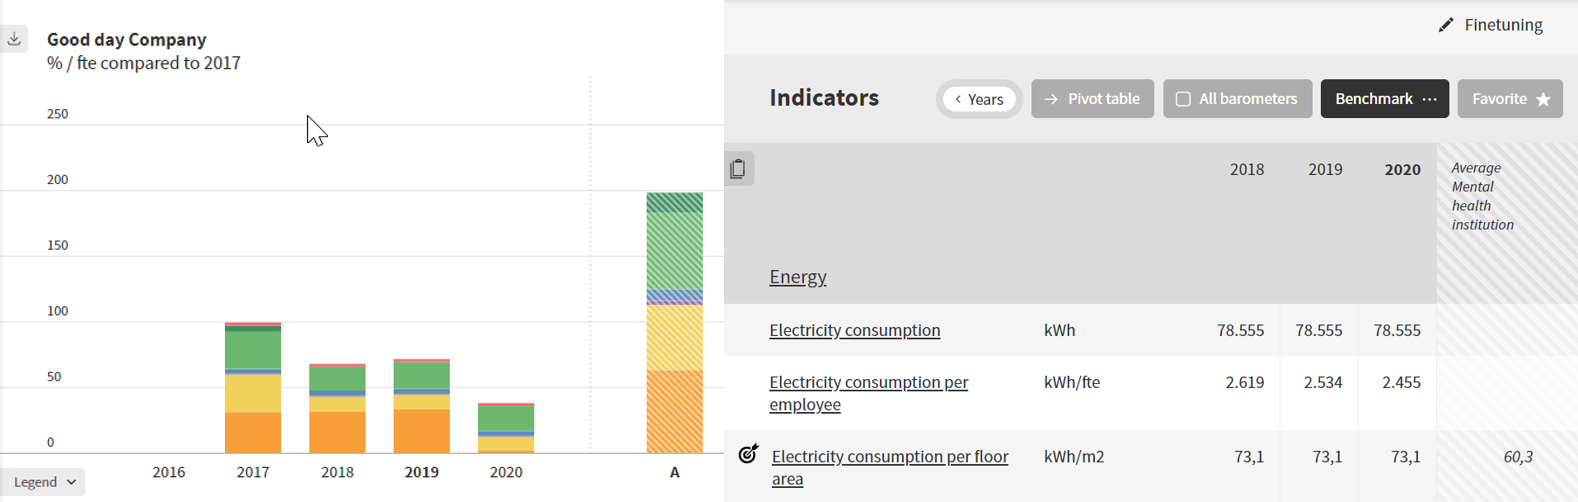
Not all indicators are included in the industry average
- An industry average (benchmark) is not available for the indicators ‘percentage night or off-peak electricity’. The reason is that the ‘night’ or ‘off-peak’ consumption times in Brabant and Limburg are legally different than in the rest of the country. It is therefore not possible to calculate a national average.
- Some indicators are absolute (not divided by the size of the organization or scope of activities) and, consequently, cannot be compared to the industry average, such as ‘building-related energy consumption’, ‘total CO₂ emissions’ and ‘scope 1 & 2 CO₂ emissions’.
- Relevant indicators differ per industry. Figures for electricity and heat per m² of floor space are almost always available, but for swimming pools, for example, gas consumption is more strongly linked to m² of pool water surface area than m² of floor space. For offices, water consumption per employee and, for theatres, per visitor is logical. That is why we select relevant indicators for each industry and make them available as an industry average (benchmark).
- For some indicators/themes, there is not enough reliable data available. In this case, we do not include that theme or indicator in the average. If, for example, out of a group of 10 organizations only two have entered their commuting kilometres, we do not include commuting in the average.