Footprints
Footprints (CO₂ or Energy) show how much each activity contributes to the total. You can choose from six types of breakdowns of footprints. You can also publish your CO₂ footprint with one click.
Look for more detailed help concerning CO₂ footprints at the general help on CO₂‑footprints
Three types of breakdown
- GHG marketbased:
- Distribution of the items over scope 1, 2 and 3 in accordance with the Green House Gas Protocol.
- This version includes a graph that shows the distribution over scope 1-2-3.
- For scope 2, the ‘marketbased’ CO₂ factors are used in this CO₂ footprint; this means that the default CO₂ factor for electricity is that of grey electricity.
- If you have green electricity, this has an effect in this footprint.
- GHG locationbased:
- Same as the previous one, except for scope 2.
- For scope 2, this CO₂ footprint calculates with the ‘locationbased’ CO₂ factors;
this means that for electricity the ‘gridmix’ CO₂ factor based on the mix of grey and green electricity. - Purchasing green electricity does not count in this footprint (because it is in the gridmix).
- Thematic:
- The CO₂footprint that follows the theme classification in the Envirometer.
- For scope 2 items, the market-based CO₂ factors are used (see above for explanation).
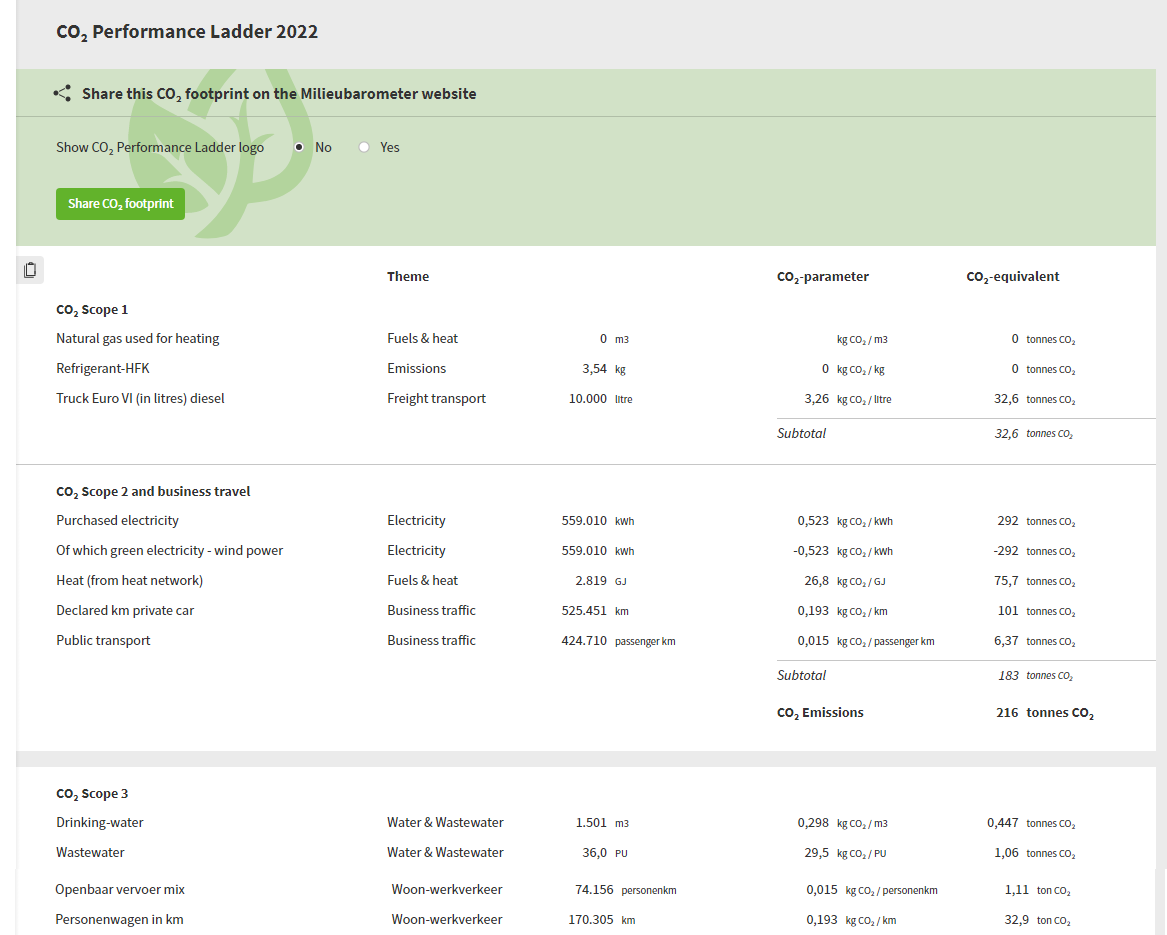
- CO₂ Performance Ladder:
- Distribution of the items over scope 1, 2 and 3 in accordance with the CO₂ Performance Ladder.
- Scope 1 is divided into:
- greenhouse effect due to CO₂ gas
- greenhouse effect due to other greenhouse gases (if you have emissions from refrigerants or methane, for example)
- Scope 2 uses market-based CO₂ factors.
- Scope 3 is divided into:
- Business traffic in scope 3 (such as air travel and declared km)
- Other scope 3. This part does not count towards the ‘total’ of the CO₂ Performance Ladder footprint.
- With the ‘hide’ button at the bottom, this footprint only shows the part for the CO₂ Performance Ladder level 1.
- Compensation is omitted here because it does not count for the CO₂ Performance Ladder.
- Energy footprint
- The equivalent of a CO₂ footprint, but for energy.
- The demarcation is energy-relevant items that fall under scope 1 and 2 of the CO₂ footprint.
- The energy footprint corresponds to the Energy graph for graphs
- It concerns the amount of energy used, this is not converted back to primary energy (e.g. the energy needed to generate your electricity).
- CSRD table:
- A compact version of the CO₂ footprint according to the GHG protocol including double scope 2 calculation according to CSRD part (E1-6). The table shows three columns (if you have already filled in so many years): start year | previous year | current year.
- The energy indicators according to CSRD section (E1-5). This concerns the energy consumption of the organization including means of transport. It corresponds to scope 1 and 2 in the CO₂ footprint.
- All indicators from the CSRD table are also available with indicators; you can attach targets to them there. With the indicators you can also read the background/delimitation of the indicators.
Edit the display
- Normalize: As with the graphs and key figures, it is possible to break down the footprint by determining specific company data and, consequently, the CO₂ footprint per, for example, printed matter or employee.
- Year parts: To the right of the graph title is a button that can be used to display the time period selected instead of the entire year. The bar graph will then show all time periods within the selected time window. The pie chart will then only show the selected time period. The view selector is set by default to semi-annual, but you can also choose to view by the four-month period, quarterly, monthly or remove this view option entirely. To adjust this, navigate to change barometer in the Envirometers management and use the ”period view” drop down menu.
Copy and publish
- Copy: The copy button to the left of the CO₂ footprint lets you export the CO₂ footprint as a table and easily copy it into Excel/spreadsheet or a report.
- Share: The ‘share’ button lets you publish your CO₂ footprint on the Envirometer website, thereby making it public. The sharing option includes the following choices:
- English or Dutch
- Type of display (CO₂ Performance Ladder, GHG Protocol, Thematic)
- Absolute or ‘normalized’
- Per year or time period
- The overview of your shared CO₂ footprints (and time periods) can be found in the Footprint menu under ‘shared CO₂ footprints’.
Important: You can share the footprints for several time periods and/or the entire year, but you can only share one per year or time period with respect to:
- Language (Dutch or English)
- Normalized or absolute
Tip: Do you want to update a shared CO₂‑footprint? First use the Stop sharing button on the CO₂‑footprint page and then share the CO₂‑footprint again with the Share CO₂‑footprint button.