Calculate your company’s carbon footprint
There is a lot to consider when calculating a company’s carbon footprint. The Envirometer has been helping companies measure and understand their carbon footprint since 1999. With clear data visuals and the current emission factors that apply in the Netherlands, you can use the output for certificates and standards.
This carbon footprint calculator is suitable for:
- Gaining insight into your own business operations
- Providing a carbon footprint table in response to a customer’s or client’s request
- Complying with standards like CSRD and SBTi
- Obtaining certificates such as CO₂ Performance Ladder and ISO 14001
You can use the carbon footprint that you measure using the Envirometer for various purposes.
Carbon footprint table
A company’s carbon footprint shows how much greenhouse gas emissions (in CO₂ equivalents) are released into the atmosphere as a result of its business activities. You can use invoices such as the energy bill and fuel cards as input. The built-in emission calculator immediately calculates your company’s carbon footprint.
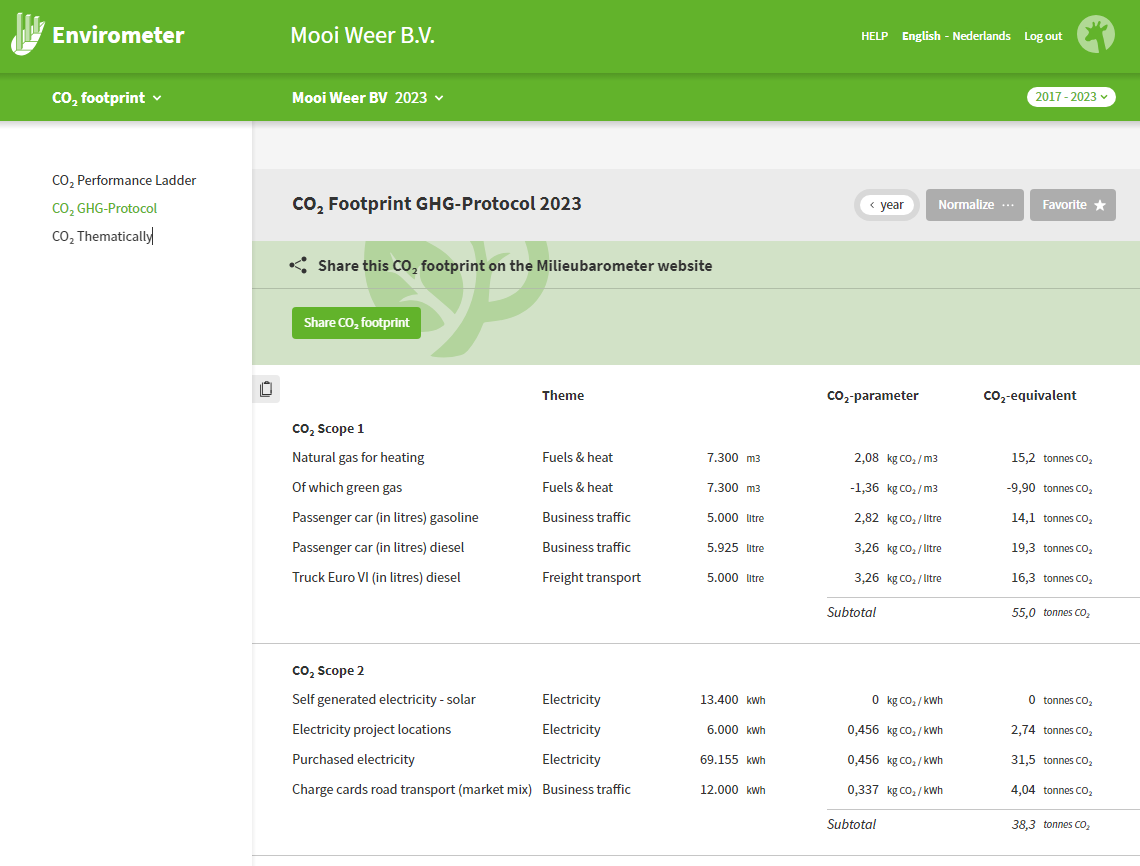
If a customer or client asks for your company’s carbon footprint, you can provide this in table form. You can choose between Scope classification according to either the CO₂ Performance Ladder or the GHG Protocol standard.
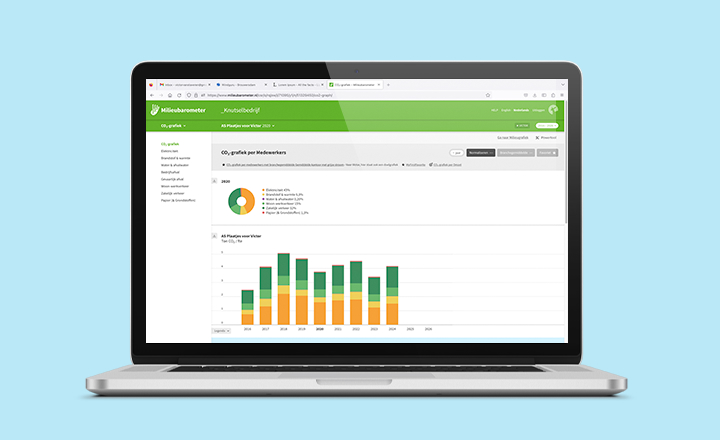
Graphs and charts clearly visualise your carbon footprint
It’s important to know where you stand. Data visuals like graphs and charts show this more clearly than a table. With data visualisation, you see right away the contribution of the topics (where you’ve entered data) to your total emissions and so know what to prioritise to cut emissions.
Carbon footprint donut chart
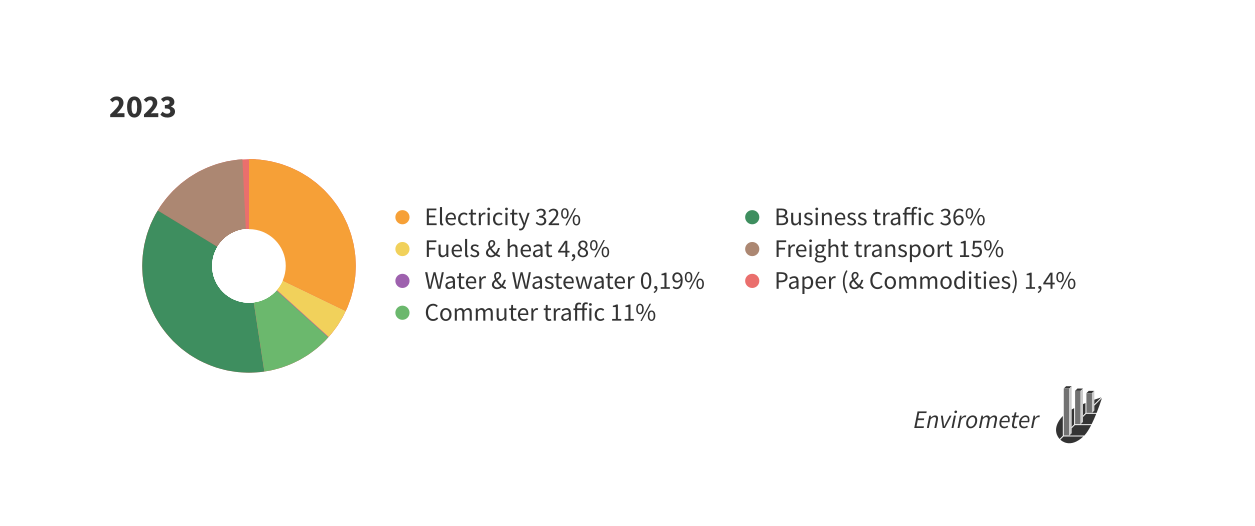
Each data visual can be downloaded as a PDF, PNG or HTML.
Donut chart per topic

By zooming in even further, you also see in which areas of your business you especially need to cut emissions. In this example, the greatest emission reductions can be achieved through the lease fleet.
Monitoring your carbon footprint
Ultimately, everyone wants the same thing: to see the carbon footprint become smaller. To monitor this, it’s good to know what is happening over time and which topics need extra attention.
Multi-year bar chart
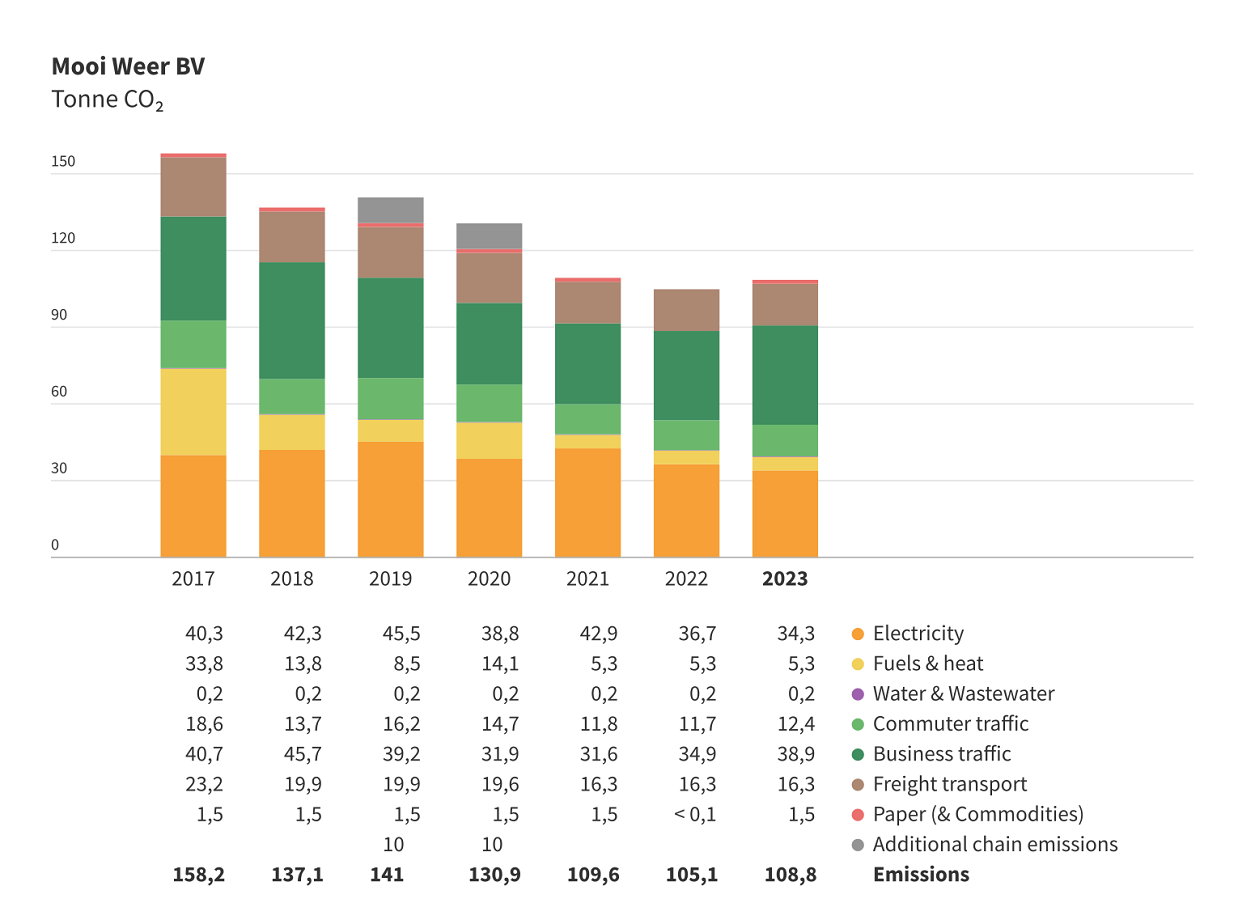
In the multi-year view you can monitor emissions over time. This can be done absolutely, or relatively by FTEs, turnover or a self-chosen production unit.
Reducing your carbon footprint
As part of the EU’s contribution to meeting the goals of the Paris Agreement (limiting global warming to no more than 1.5°C), the EU is targeting a cut in emissions of 55% by 2030 and reaching net zero by 2050. With the Envirometer you can show how your company is doing when it comes to reducing greenhouse gas emissions.
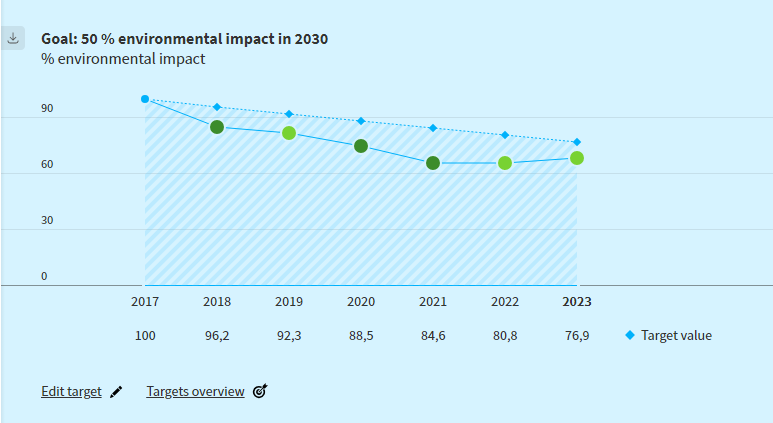
You can visualise any target using the ‘goal-line chart’.
Benefits of the Envirometer
These are the benefits of working with the Envirometer as a carbon footprint calculator:
- You get the current Dutch emission factors for Scopes 1 and 2.
- You can add emission items yourself, also for Scope 3.
- You can view published carbon footprints.
- You can see/present your carbon footprint per quarter, 4-months, half year.
- You can download all data visuals in PDF, PNG or HTML to paste into Word yourself.
- You can get complete reports in a PDF document.
- You see a list of required data.
- You get key figures for the CO₂ Performance Ladder and Climate Neutral.
- You get support from helpful helpdesk staff and options for additional coaching.
Get started with the Envirometer
Want to get started immediately? No problem! Take out a subscription today and get started by filling in your details.

The Envirometer is the standard when it comes to carbon footprinting.
Frequently asked questions
Looking for an answer and your question is not listed? Then take a look at our FAQ overviewpage
-
For which certifications can I use the Envirometer?
-
Companies use the Environmental Barometer for the CO₂ Performance Ladder, ISO-14001, SBTi, B-Corp, Environmental Thermometer Care, CSR Guide, and CSR Performance Ladder.
-
Can I use the Envirometer for the CSRD?
-
Yes, the data from the Envirometer can be used in the CSRD report.
-
What is the added value of the Envirometer over free CO₂ footprint tools?
-
Important advantages of the Envirometer are:
- You can compare CO₂ emissions over multiple years.
- You can correct and supplement data (in practice, the data is not complete in one go). With a free tool, you have to re-enter everything.
- You can also register waste and water consumption. For many companies, it is beneficial to have all this information in one system.