Internal and external communications
Using the charts, graphs and tables in your internal and external communications is a great way to make data relating to your sustainability measures more accessible and understandable.
Communicating about sustainability within the company
For sustainability measures to succeed, employee awareness and cooperation is essential. By using the data visuals and tables from the Envirometer, your employees can:
- Become aware of the impact of the various business activities (see Baseline measurement)
- Think about possible ways to reduce impact for activities with a high impact
- Step up the pace if it appears that the targets are not being achieved (see Monitoring and making adjustments)
- Assess the impact and progress towards reducing the impact, for example in a management meeting
Communicating about sustainability with external parties
An increasing number of external parties, like customers and clients for example, expect your company or organisation to work on sustainability matters. Occasionally external parties ask for sustainability data like a company’s carbon footprint. With the data visuals and tables from the Envirometer you can tell external parties about:
- The environmental impact or carbon footprint of your company or organisation
- Your progress towards the set sustainability targets
Options for communication with the Envirometer
You can choose from various options for communicating with the Envirometer, depending on your objective and target group:
- reports
- published carbon footprint
- data visuals to use in communications
Reports
With the PDF report generator you can quickly create a clear and immediately usable Envirometer report: you can show to interested parties. The report is available in five formats. You choose the elements (charts, graphs, tables, lists) that will be included in the report. You can also export your data to Excel.
Publishing your carbon footprint
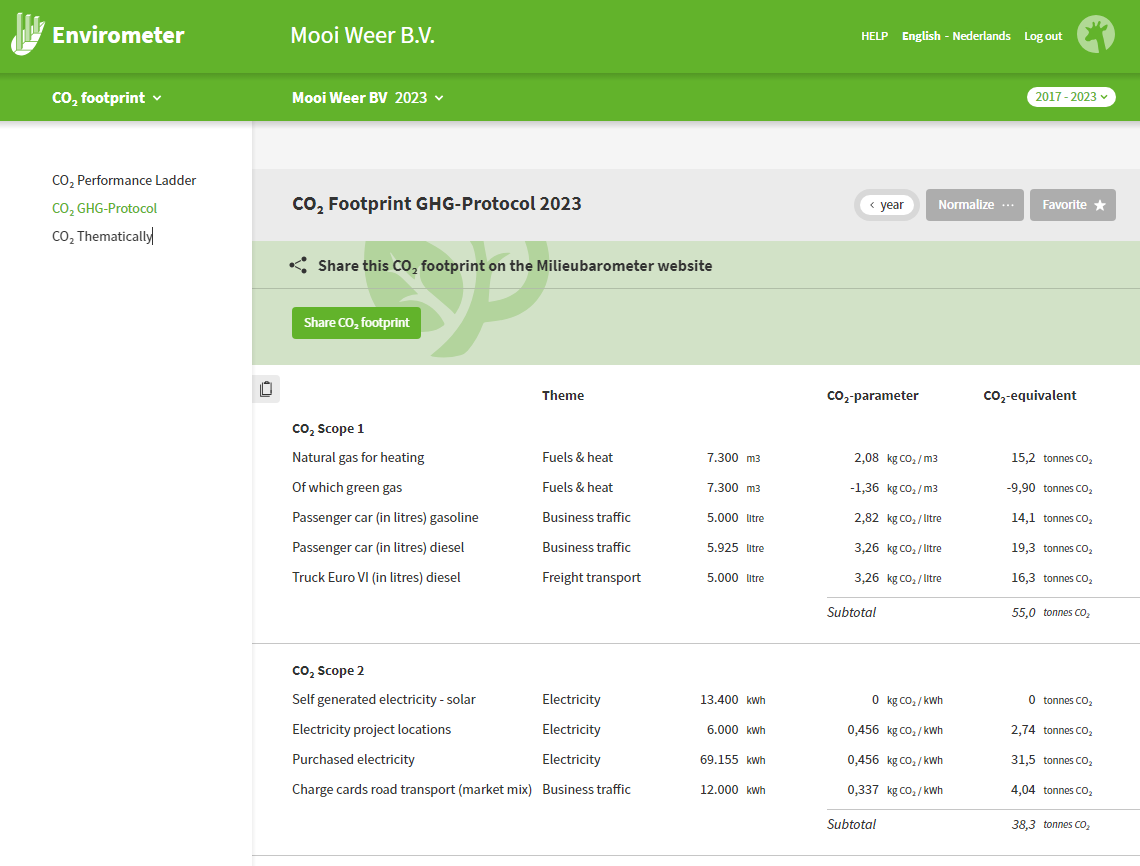
Once you have entered your energy data for buildings and transport in the Envirometer, you can publish your carbon footprint and make this public at the touch of a button.
Data visuals to use in communications
You can download the data visuals and tables separately and add them to:
- internal and external annual reports
- your sustainability report
- your sustainability webpage
- a presentation for a client
Get started with the Envirometer
Want to get started immediately? No problem! Take out a subscription today and get started by filling in your details.

Frequently asked questions
Looking for an answer and your question is not listed? Then take a look at our FAQ overviewpage
-
How do I share the output I receive?
-
There are several ways to share your results:
- You can download each chart as a PNG, PDF, or HTML.
- The tables for the CO₂ footprint and key figures have a handy copy button.
- The PDF report generator allows you to create a formatted Envirometer report; you can choose which elements (charts, tables, overviews) to include in the report.
- You can also make the CO₂ footprint public, which will then be displayed on the website.
- You can even add an external user and grant them ‘read-only’ access.