New: Waste in CO₂‑footprint
The CO₂ footprint in the Envirometer has been expanded to include the theme of waste. All waste streams have been assigned a CO₂ factor. In the CO₂ graphs and CO₂ footprints, the CO₂ emissions from waste are now automatically calculated for every user, in terms of the GHG protocol: Scope 3 category 5.
Waste in your CO₂ footprint
Generic Dutch CO₂ emission factors for waste have been included in the Milieubarometer since March 31, 2026. This is prompted by the publication of Dutch CO₂ factors for waste on CO₂‑emissiefactoren.nl. As a result, CO₂ emissions from waste are now visible in the Envirometer, in graphs and footprints. Consequently, ‘Waste from business activities’ (Scope 3 – category 5) has been included in the GHG footprint.
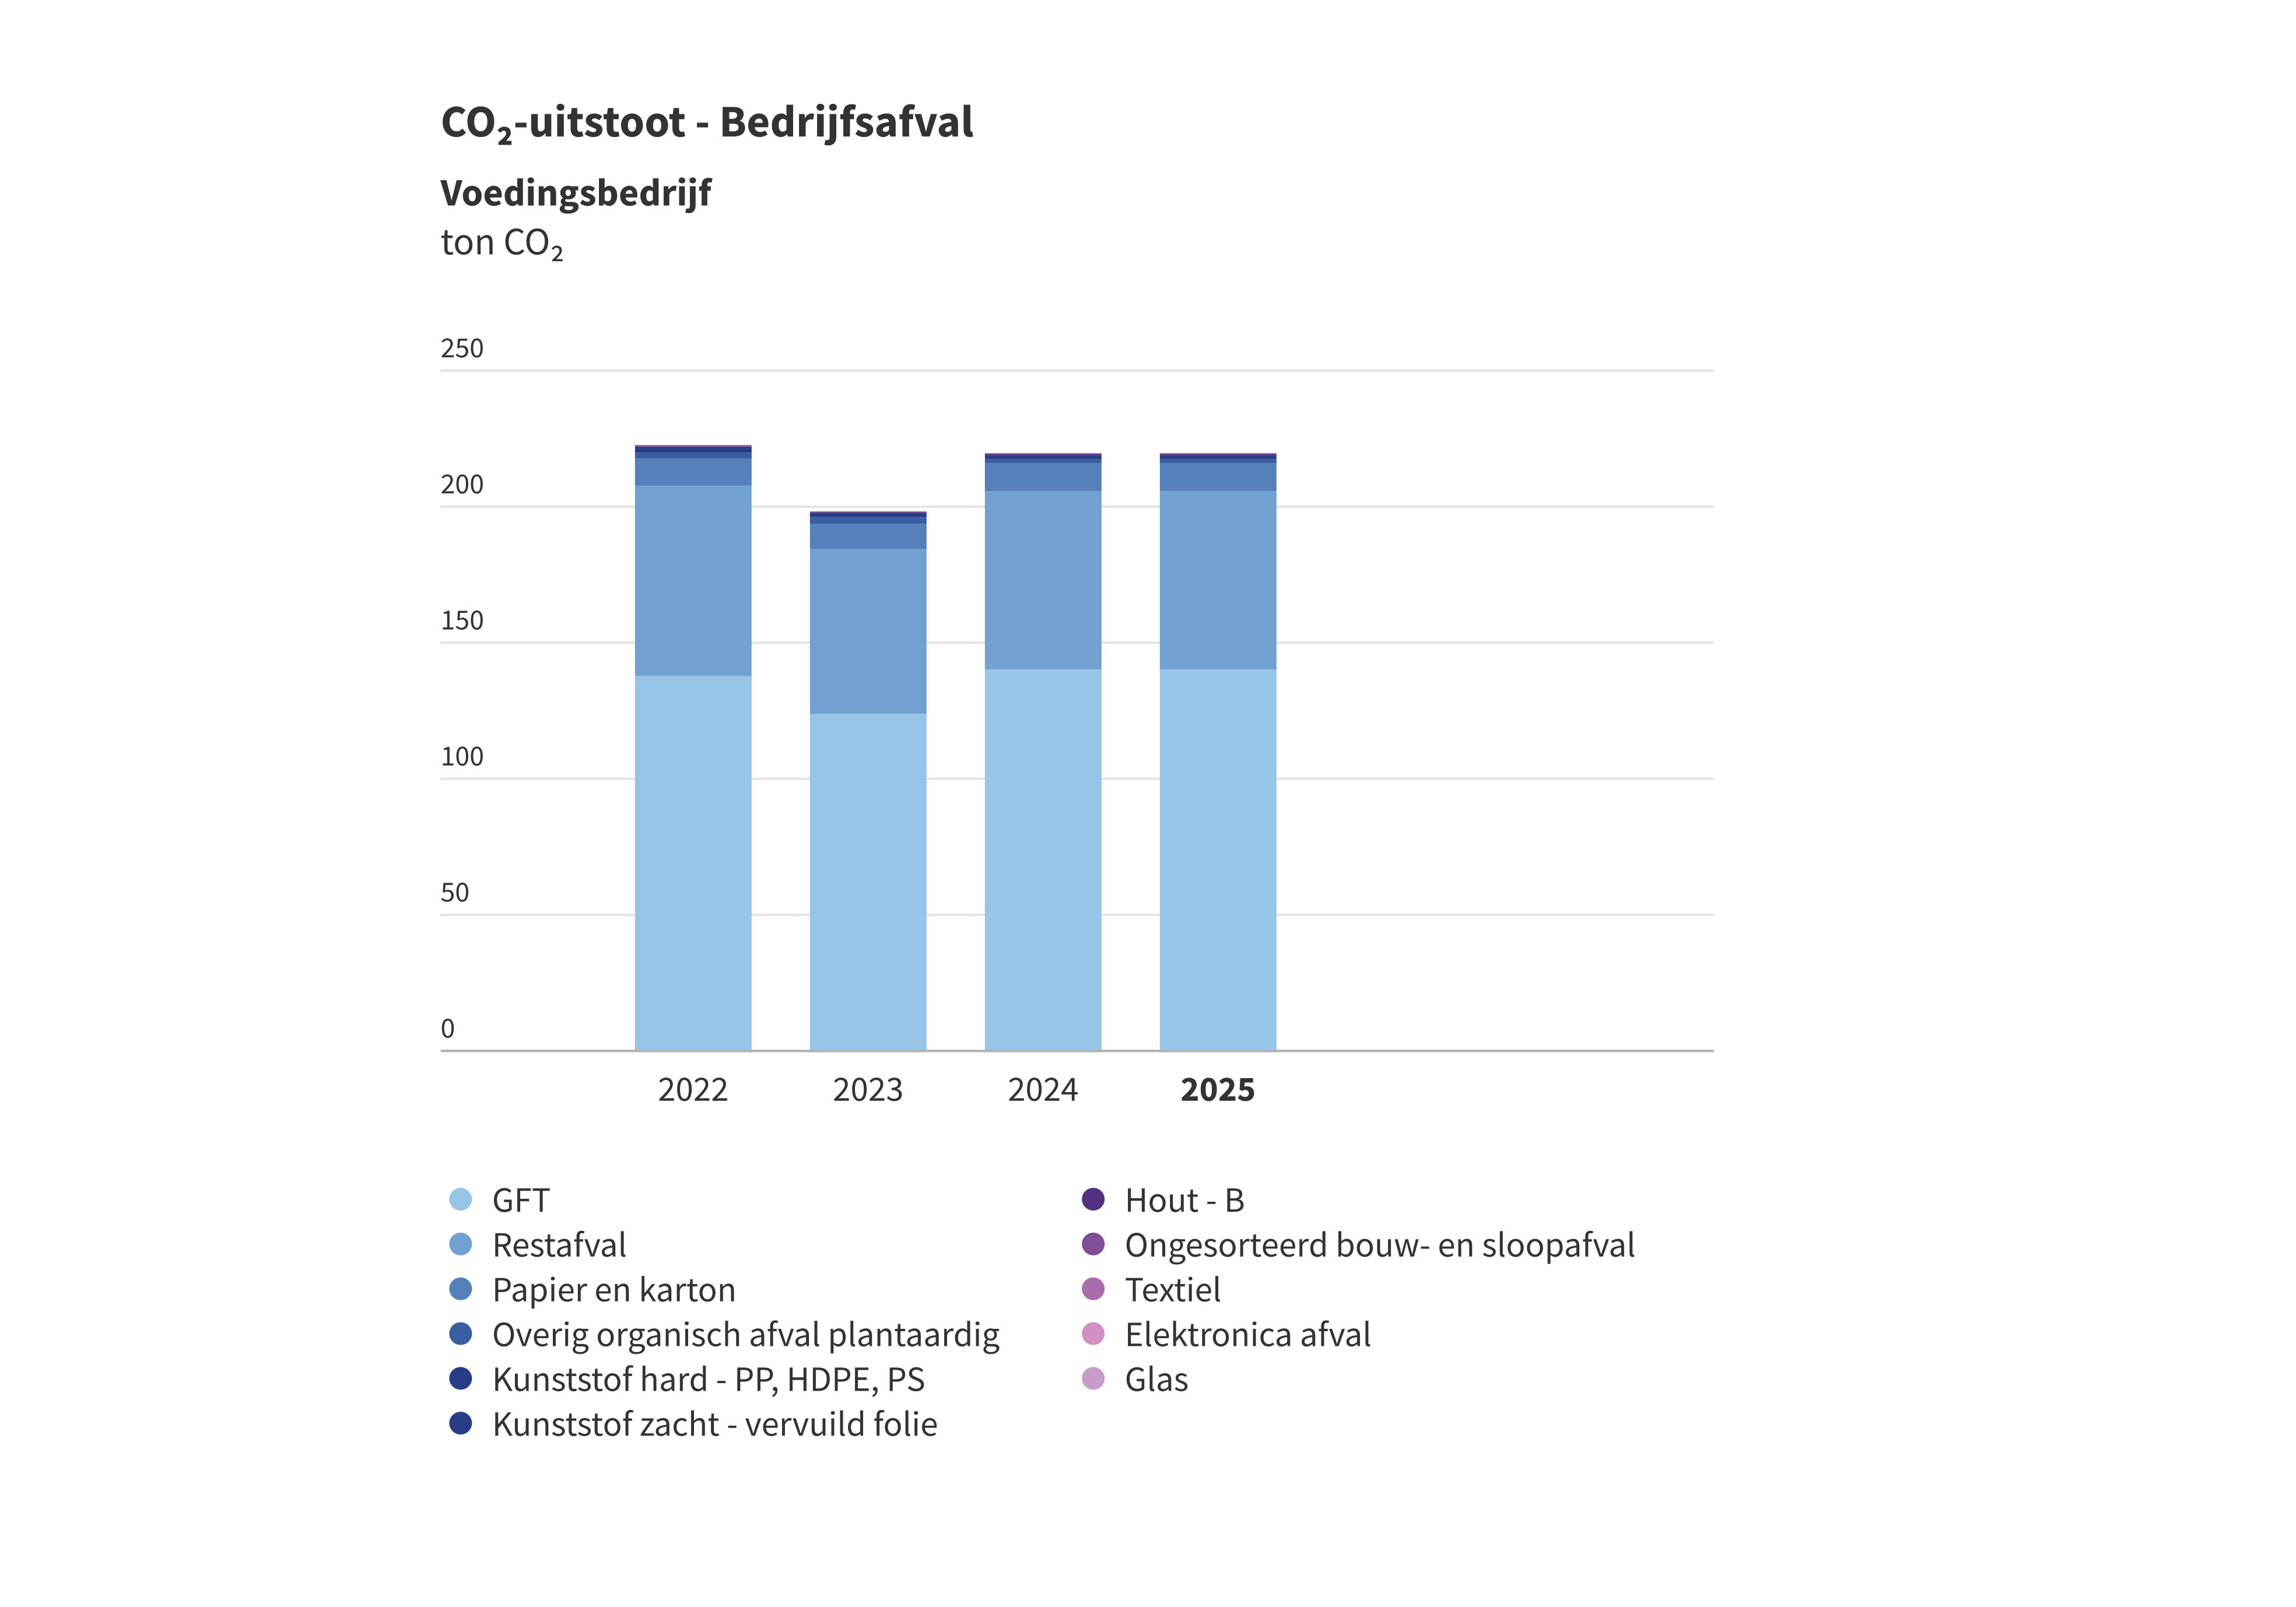
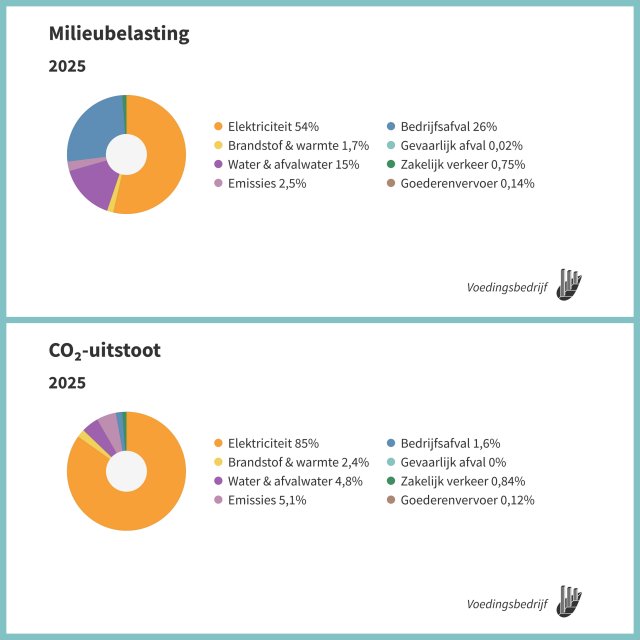
CO₂ emissions from waste turn out to be small, often no more than 1-2% of companies’ footprints. This is because CO₂ emissions from materials are primarily accounted for through procurement (Scope 1 – category 1) and because a CO₂ footprint represents only a part of the environmental impact. To analyze the impact of disposal, CO₂ emissions from waste are not a suitable indicator. In the Envirometer, the environmental impact of waste is better reflected in the environmental graph, in which waste is included based on environmental costs. The example of the food company below shows the magnitude of the difference between the share of waste in the CO₂ graph and in the environmental graph.
Tips regarding CO₂ emissions from waste
- Do not use CO₂ emissions from waste as an indicator for circular business operations / the handling of raw materials. Instead, in the Environmental Barometer, you can track the impact of waste via the Environmental Graph, the Waste Weight Graph, and various key figures to monitor the waste volume.
- If your waste collector provides specific CO₂ factors that differ from CO₂‑emissiefactoren.nl, you may use those. However, ensure that they are clearly defined and suitable for a GHG footprint (see explanation below).
- You can choose to view waste as ‘non-material’ and not include it in your CO₂ footprint. In the Environmental Barometer, you can do this by setting the CO₂ factors for waste to zero.
CO₂ factors for waste
Since March 2026, CO₂ factors are available on CO₂‑emissiefactoren.nl for approximately thirty waste processing routes. These are generic factors for average waste processing routes in the Netherlands. We have linked all waste streams in the Environmental Barometer to one of the available waste routes; see the explanation at the bottom of this page.
Lots of CO₂ emission factors for waste are around, but not all of them are suitable for a CO₂ footprint in accordance with the GHG protocol. The GHG protocol stipulates that the following must be included as CO₂ emissions from waste:
1. waste transport to the first location where the waste is collected.
2. waste processing (sorting/shredding/washing) before it is transported or processed further.
3. incineration – if the waste incineration plant (AVI) does not have energy recovery. Because Dutch waste incineration plants are equipped with energy recovery as standard, the CO₂ emissions from incineration in the Netherlands do not count towards the CO₂ factor for waste.
CO₂ factors that include CO₂ emissions from incineration, recycling, and other steps in the processing chain are interesting for comparing waste processing routes and life cycles, but do not meet the definition in the GHG Protocol.
CO₂ factors in the Envirometer
For waste, the Envirometer uses the GHG CO₂ factors as published on CO₂‑emissiefactoren.nl. The Envirometer includes many more waste streams than the waste processing routes on CO₂‑emissiefactoren.nl. For all waste streams, we have selected a waste route that we believe is most comparable in terms of transport and processing. Below, we justify this choice based on the factors.
- Residual waste – 38 kg CO₂/ton of waste
- Residual waste (partially post-separated, chosen factor without post-separation)
- Wood-C
- Hardened resin residues
- Category 1 meat waste
- Residual waste (with post-separation) – 48 kg CO₂/ton of waste
- Voluminous commercial waste
- Biogenic waste (to anaerobic digestion or composting) – 7 kg CO₂/ton of waste
- Organic waste, Swill
- Meat waste
- Manure, feces, urine
- Other organic waste
- Coffee grounds*
- Frying oil*
- Green waste (to bioenergy plant) – 38 kg CO₂/ton of waste
- Green waste (partially composted – chosen route)
- Paper and cardboard – 7 kg CO₂/ton of waste
- All waste streams containing paper and cardboard
- Wood – 7 kg CO₂/ton of waste
- Wood category A and B
- Wood dust
- Construction waste (sorted) – 8 kg CO₂/ton of waste
- All sorted waste streams in the Construction waste category
- Tar-free asphalt
- Construction and Demolition waste (with post-separation) – 16 kg CO₂/ton of waste
- Construction and Demolition waste
- Roofing waste*
- Glass – 26 kg CO₂/ton of waste
- Glass
- Plastics – 51 kg CO₂/ton of waste
- All types of plastic (mono and mixed streams)
- Stone and glass wool
- All types of rubber (tires)*
- Packaging materials containing plastic (PD, beverage cartons, cups, toner cartridges)
- Textiles*, mattresses*, carpet remnants*
- Incontinence material*
- Metals – 32 kg CO₂/ton of waste
- All types of metal (mix)
- All types of electrical appliances (White goods, Brown goods, and electronics)
- Uncontaminated blasting grit
- Hazardous waste – 38 kg CO₂/ton of waste
- All hazardous waste streams
- No CO₂ factor for packaging materials that are reused
- Pallets and Crates
- IBC containers, Plastic drums, Metal drums, Jerrycans
- Particularly for the waste streams marked with an *, no comparable waste processing routes are available. We have assigned these based on comparable materials and/or waste density. Almost all of these concern streams that are (partially) recycled.