Setting and monitoring targets
The Envirometer allows you to see which issues have the most impact on your company or organisation quickly, such as natural gas and business travel. Use the target function to record targets for reducing your impact. The Envirometer makes choosing and monitoring quantitative targets easy. Your progress towards attaining your targets is summarised in the target dashboard.
Managing sustainability and climate neutrality
Quantifying and monitoring sustainability goals allows you to manage the impact of your organisation. This makes it easier to see if you are making sufficient progress, such as halving your footprint by 2030 or even becoming climate-neutral. Or that you are on track for your chosen waste separation target of 85% by 2025. Targets and indicators are part of sustainability certificates such as ISO 14001, CSR certificates and the Dutch CO2 Performance Ladder, for a reason; they help you to move in the desired sustainable direction.
“The new Envirometer looks really cool. The direct link between the data you enter and the targets of your company is a huge benefit compared to the previous version.”
Henk Huijzer,
mth accountants
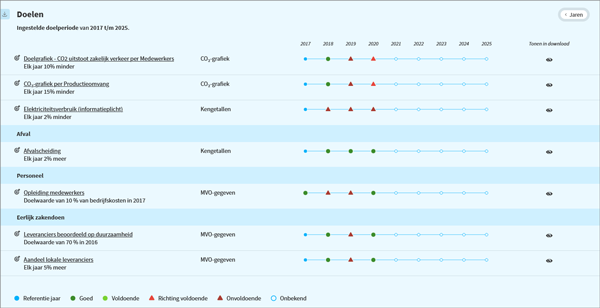
Target graphs
After setting your targets, you can see your progress in the target graphs. The target is represented by the shaded target area. The Envirometer uses traffic light colours to show whether you are achieving your goals.
Measuring wider sustainability (CSR)
The Envirometer allows you to expand environmental measurements to include elements of Corporate Social Responsibility (CSR). In addition to environmental data, you can enter additional data of your choice and generate target graphs. For example, data on employee satisfaction, accidents or renewable resources. The Envirometer provides suggestions for measurable CSR indicators that you can select and possibly adjust. Read more about measuring wider sustainability.
Targets dashboard
The target dashboard shows you the score of all your goals in one overview. This allows you to see from the traffic light colours whether you are achieving your goals. You can completely customise the layout, order and text of your targets.
Report
You can include the target dashboard and target charts in the Envirometer pdf report. The target graphs can also be individually downloaded for use in your own report or review.
Return to the guided tour